A Saturday-by-Saturday look at single-family inventory and prices, January 1994 through May 2026.
The chart that started this
Most local real-estate market reports show you the past quarter, maybe the past year. The view is always too short to see the patterns that actually shape the market you live in. So I went the other way and pulled every single-family listing in Reading, Massachusetts going back as far as MLS PIN’s records reliably extend — to 1994.
The dataset: 9,268 unique single-family listings, each with its list date, off-market date, status, list price, sale price, and original price. From that, I computed the active inventory on every Saturday for the past 32 years (1,689 Saturdays in total), monthly median sale prices, days on market, and a handful of other “market temperature” metrics.
The results tell a story you can’t see from a single year of data — and one that lines up, with some informative differences, with what economists are documenting at the regional and national level.
The headline: inventory collapsed early, prices kept climbing
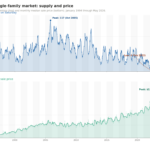
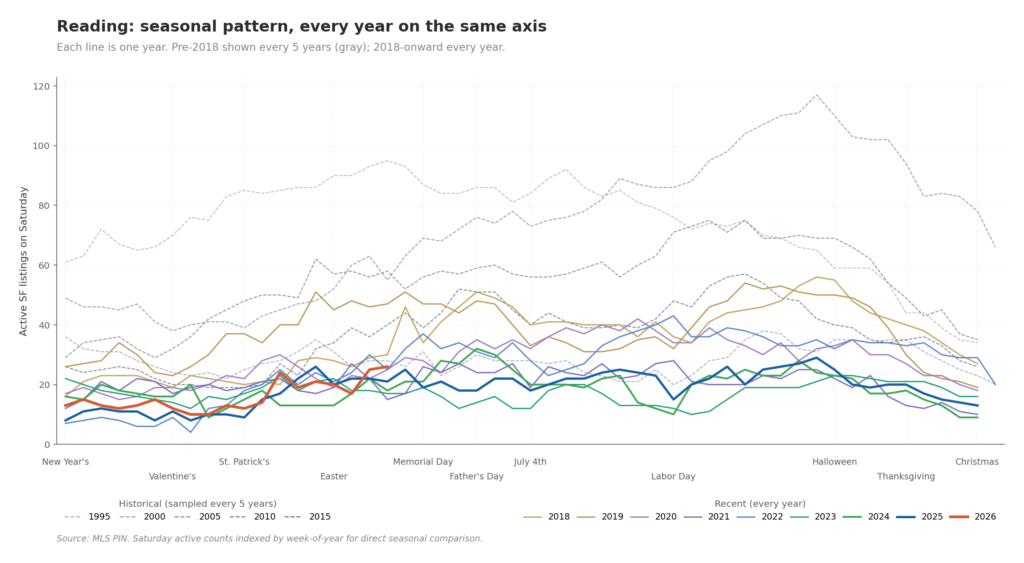
In October 2005, there were 117 single-family homes for sale on a Saturday in Reading. In February 2022, there were four. That’s a 29-fold reduction. And the median sale price went from about $198,000 in early 1994 to a smoothed peak of roughly $1,167,000 in April 2026 — about 5.9x in nominal terms, or roughly 2.6x after adjusting for inflation.
What’s most striking about Reading specifically isn’t the magnitude of the change — that’s a pattern across Eastern Massachusetts — but the timing. Reading hit its all-time inventory low on February 19, 2022, more than three years before most surrounding towns reached their own troughs. Reading was at the leading edge of the post-pandemic supply collapse, and it has spent every year since 2020 at structurally constrained levels — annual mean Saturday inventory of just 17 to 28 listings, compared to 60-90 in the 1994-2012 era. As of Saturday, May 9, 2026, there were 26 active single-family listings — in line with the spring listing ramp seen in 2024 and 2025, and well below the 30-50 typical for early May before 2020.
What the long view changes
A few patterns become visible only when you have decades of data, not years:
The 2008 crash showed up in prices but not inventory. Most people remember 2008-2010 as a period of rising inventory and falling prices — the classic crash signature. In Reading, inventory actually fell during the crash, from a peak of 117 in 2005 to under 70 by 2009. The crash didn’t unleash a wave of for-sale signs; it froze the market. Prices did correct: the smoothed median fell from a $465K peak in 2007 to about $370K by 2011, roughly a 20% drop. That’s a more meaningful price decline than many Greater Boston towns saw, but still far short of the 30-50% declines that hit metros like Phoenix or Las Vegas.
The structural inflection wasn’t 2008. It was 2013. From 2005 through 2012, mean Saturday inventory in Reading ranged between 50 and 87 listings. In 2013, the annual mean dropped to 35.5 — a 44% one-year fall — and the baseline never returned. Every subsequent year through 2019 hovered between 30 and 40. By 2017, the year’s peak Saturday count was 49 listings — lower than the trough of any year from 2005 through 2012. This wasn’t a cyclical downturn. It was a structural shift, and you can pinpoint it almost exactly to that year.
COVID didn’t cause the listing collapse — it accelerated something already happening. Mean Saturday inventory was already down to 28 in 2020 before the pandemic took hold. By 2021 it was 20.5. The pandemic and rate-lock effect (more on that below) added a layer on top of an ongoing structural shift, but the descent had been going for years. What COVID accelerated for Reading wasn’t a new pattern — it was a faster collapse along an existing trajectory.
Reading also had a “first tight market” around 2000. A pattern often missed by short-window analysis: Reading’s mean Saturday inventory dropped from 73.8 in 1995 to just 28.3 in 2000 before rebounding through the bubble years. The 2000 trough was the tightest the market would be for the next 13 years — a preview, in retrospect, of the structural era that began in 2013.
Why this is happening: the regional and national context
Reading isn’t unique. The single best explanation for the post-2013 collapse in inventory comes from Federal Reserve and FHFA research on what economists call the “rate lock-in effect.”
When mortgage rates rose sharply in 2022, homeowners with low fixed-rate mortgages — most of them locked in during the 2020-2021 refinancing boom — suddenly had a powerful financial reason to stay put. According to the Federal Housing Finance Agency’s working paper on the lock-in effect, every percentage point that market rates exceed a borrower’s existing fixed rate reduces the probability of sale by 18.1%. The paper found that mortgage rate lock-in prevented an estimated 1.33 million U.S. home sales between mid-2022 and the end of 2023, and increased home prices by 5.7% by reducing supply.
But here’s the important wrinkle: lock-in alone doesn’t explain Reading’s full picture, because the Reading inventory decline started years before rates rose. The region has a deeper, structural problem layered on top of the rate-lock effect. Massachusetts faces a housing supply shortage estimated at over 200,000 units. State analysis underlying the Affordable Homes Act suggests the Commonwealth needs to produce more than 200,000 new housing units by 2030 just to meet current demand, and the MBTA Communities Act — the state’s most ambitious effort to ease zoning restrictions near transit — has so far put only a small fraction of that need into the development pipeline. Reading is a designated MBTA Communities town with commuter rail access to Boston, which puts it squarely in the policy spotlight even as new construction has remained limited.
Decades of restrictive zoning, lot-size minimums, and local opposition to multi-family construction have left Eastern Massachusetts structurally short on housing — and that shortage was already binding when the rate-lock shock arrived. Lock-in didn’t cause the Reading shortage; it amplified one that already existed. As The Warren Group — the firm that has tracked Massachusetts real estate data since 1872 — has documented in their statewide reporting, this is a regional pattern across Greater Boston, not a Reading-specific phenomenon.
The price story — why median, not average
Reporting median sale prices rather than averages matters more than people realize. Real estate prices are right-skewed by definition — there’s no upper limit on what a luxury home can sell for, but a lower bound near zero. A handful of trophy sales can pull the average significantly above what a typical buyer actually faces.
In Reading’s 2024 data, the median sale was $855K but the mean was $949K — a $94K gap explained entirely by a few sales above $1.8 million. By 2025, the top sale was 2.5x the median (compared to 2.2x in 1994). Every reputable real estate index — Case-Shiller, the National Association of Realtors, Redfin, Zillow — uses median for exactly this reason.
Looking at the Reading median over time:
- 1994-2007: $198K → $465K (2.3x over 13 years, including the bubble run-up)
- 2007-2011: $465K → $370K (a 20% crash-era correction, larger than most Greater Boston towns)
- 2011-2025: $370K → $912K (2.5x over 14 years)
The 2020-2022 acceleration is the steepest in the entire record. The smoothed median went from about $595K in early 2020 to $777K by mid-2022 — a 31% jump in two years, faster than even the 2003-2007 bubble. The trajectory continued through 2025, with monthly readings settling into a $900-$960K range. Early 2026 monthly medians have been noisier on smaller samples, ranging from $725K in December 2025 to $1.21M in May 2026, with the smoothed three-month series peaking at $1,167K in April 2026.
For broader regional context, Massachusetts had over 43,000 single-family home sales in 2025, with the statewide median single-family sale price reaching $638,000 — and Greater Boston specifically reaching a median single-family sale price of $799,000. That puts Reading’s $912K stable 2025 median well above both the statewide and Greater Boston medians, reflecting the town’s premium school district, commuter-rail access, and limited single-family supply.
What sellers and buyers actually feel: the “market temperature” indicators
Inventory and price are the headline metrics, but they’re outcomes. The richer story comes from looking at seller behavior — and the MLS data is full of it.
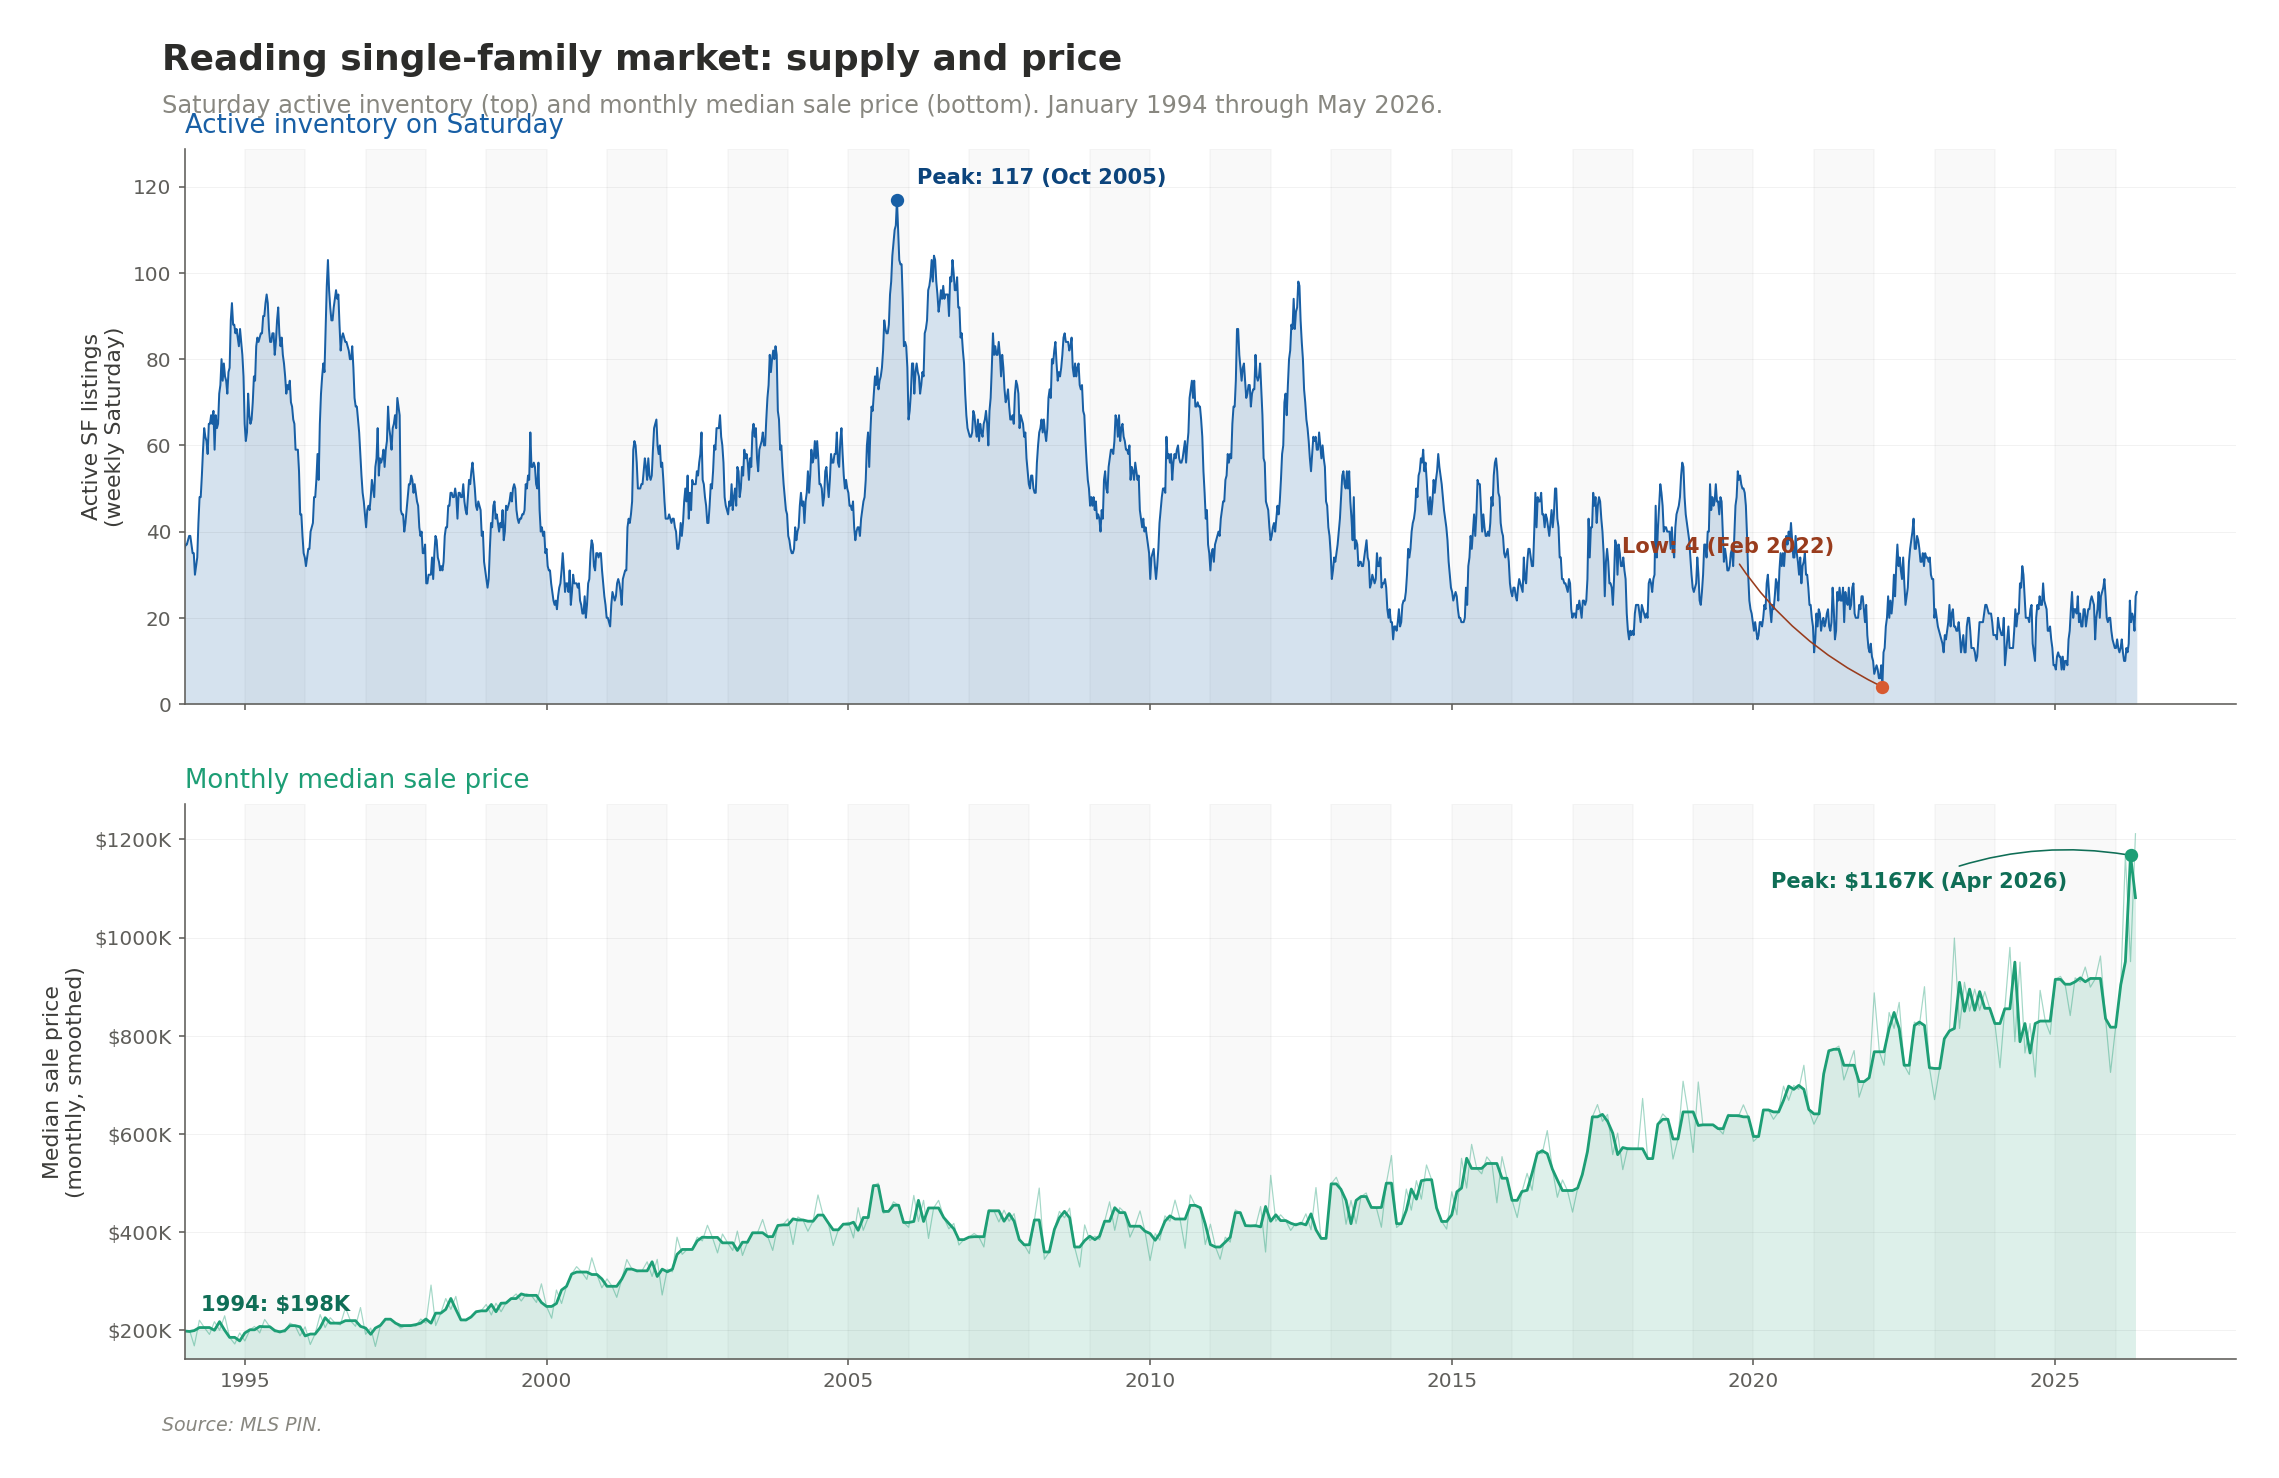
Listing failure rate (the share of listings that ended up cancelled, expired, or withdrawn rather than sold) tells you how often sellers are disappointed. In 2005, 44% of Reading listings failed — a textbook bubble signature where sellers were mispricing wildly. By 2021 the failure rate had collapsed to just 7.8% — the tightest market on record. In 2025 it ticked back up to 12.0%, still well below historical norms but the highest since 2022.
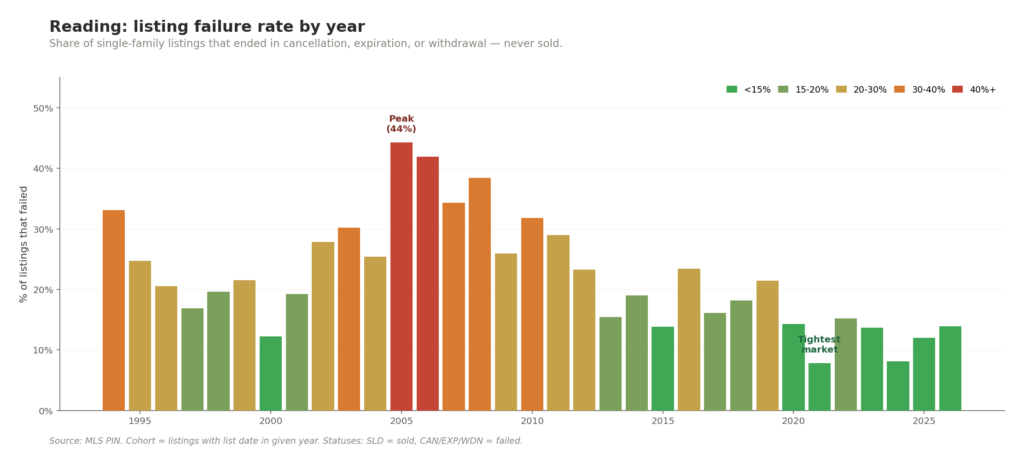
Sale-to-list ratio captures bidding-war energy. The crossover when listings routinely sold over asking happened in 2013-2014, not 2020 — six years before most people associate it with the pandemic. By 2025, 68.5% of Reading single-family sales went for over asking, up from 65% in 2024. The pandemic intensified an already-established trend, and that trend has not let up. (If you’re a seller thinking about pricing strategy, this is the metric to watch — it tells you what other sellers are getting.)
Median days on market dropped from 49 days in 2011 to just 14 in 2025 — a measure of how rapidly homes clear when supply is tight and buyers are competing. Reading’s 2025 reading of 14 days was actually faster than 2024’s 16 days, the opposite of what we saw in some neighboring towns, and 2026 sales so far have closed in a median of 13 days.
Price-cut frequency dropped from 58% of listings in 2005 to 17.5% in 2025. Sellers in recent years simply haven’t needed to discount, and that pattern continued into 2025: the price-cut share fell from 20.5% in 2024 to 17.5% in 2025 — another sign that Reading sellers held firm on asking prices.
Taken together, these four metrics suggest Reading is not cooling in 2025 the way some neighboring towns are. Failure rate ticked up modestly, but the sale-to-list ratio rose, days on market fell, and price cuts grew less common. Early 2026 readings have continued in the same direction: median sale-to-list ratio of 104.7%, 66.7% of sales over asking, and 13-day median days on market. That’s a market that remained taut through 2025 even as the broader region showed early signs of rebalancing — a reminder that “the Greater Boston housing market” isn’t a single thing, and town-level differences matter a great deal.
How Massachusetts compares to the rest of the country
The U.S. picture in 2025-2026 has been one of slow, partial recovery in inventory. The National Association of Realtors reported that U.S. existing-home sales hit roughly 4 million annualized in early 2026, with a national median sales price near $400,000 and 3.7 months of inventory — well below the 6-month threshold typically considered balanced.
What this means: nationally, supply has improved meaningfully from the 2022-2023 lows. But that recovery is heavily concentrated in the Sun Belt and the Mountain West. In parts of the South, like Texas, Florida, and Tennessee, inventory has not only recovered but is now higher than before the pandemic. The Northeast and Midwest still remain tight.
Reading — and Eastern Massachusetts more broadly — sits firmly in that “still tight” category. Whatever rebalancing is happening nationally hasn’t reached us in any meaningful way yet. The state’s inventory remains structurally short of demand by hundreds of thousands of units, the rate-lock effect remains binding for the majority of homeowners, and zoning reform — though slowly progressing — is producing only a fraction of what’s needed.
What 2026 looks like so far
Through Saturday, May 9, 2026, Reading has had between 10 and 26 active single-family listings on any given Saturday, with a year-to-date average of 16. Today’s reading of 26 is the year’s high so far, reflecting the normal spring listing ramp — but it’s still well below the 30-50 typical for early May in the pre-2020 era. Even at this seasonal peak, 2026 inventory is roughly half of what was normal for mid-spring before the pandemic.
The 2026 numbers are slightly different in nature from the historical ones — they’re an instantaneous read on a moving target, with some listings still active and not yet closed out. By next Saturday, some of those 26 will be under agreement and a few new listings will appear. The methodology handles this correctly, but the latest few data points have a different statistical character than the rest.
What I’d watch in 2026: does the 2025 tightening hold, or does Reading finally start to show the early-cooling pattern that some surrounding towns are showing? Reading’s 2025 was a year of tightening when much of the region was loosening; the question for 2026 is whether that resilience continues or whether the regional trend eventually reaches Reading too. The first four months of 2026 sales data point firmly to “the resilience is continuing.”
Living in Reading beyond the data
The numbers tell one story, but they’re not the whole reason people choose to live here. Reading sits 14 miles north of Boston, on the Haverhill commuter rail line and at the intersection of I-93 and Route 128/I-95 — one of the most transit-accessible suburbs in the region. The compact downtown along Main Street has a walkable mix of restaurants, shops, and the Reading Public Library, and the town has consistently ranked among the top school districts in Massachusetts. Birch Meadow Park, the Town Common, and the trails along the Ipswich River give Reading more outdoor character than its proximity to Boston suggests, and weekends here often feel a few miles further from the city than they actually are.
If you’re new to the area or thinking about moving here, our Reading community page covers neighborhoods, schools, and the practical side of settling in. We also publish a weekly events guide covering Reading and surrounding towns — local festivals, restaurant openings, town meetings, and the sort of family-friendly things that don’t show up on a Boston-wide calendar. It’s our most-read content for a reason: people don’t just want to know what a town’s housing market looks like, they want to know what life there feels like week to week.
A note on methodology
All data in this post comes from MLS PIN, the multiple listing service for Eastern Massachusetts. I pulled every Reading single-family listing with list date in 1991 through May 2026 using a “list date in [year]” filter to ensure each listing is counted exactly once.
The pre-1994 records were excluded from the analysis because MLS PIN’s coverage during the database’s early years was incomplete (1992 had only 44 listings entered, vs. 305 in 1994), reflecting the gradual onboarding of brokers rather than the actual market. The published analysis covers 9,268 Reading single-family listings from 1994 forward.
Active inventory on each Saturday was computed as: list date ≤ Saturday AND off-market date > Saturday (or off-market date null). For the 26 currently-active listings without an off-market date, this correctly represents them as still on the market today. Median monthly sale prices were computed from sold (status SLD) records only, with sale price > 0 and a valid settled date.
The full underlying dataset, the per-Saturday inventory series, the monthly price series, and the market-temperature indicators are all available in CSVs derived from the same source data — making it possible to verify any specific claim in this post or extend the analysis in directions I didn’t go.
Frequently asked questions about the Reading housing market
What is the current housing inventory in Reading, Massachusetts?
As of May 9, 2026, there were 26 single-family homes actively for sale on a Saturday in Reading, MA — reflecting the normal spring listing ramp. Year-to-date 2026 active inventory has ranged between 10 and 26 listings on any given Saturday, with an average of 16. Even at this seasonal high, current inventory is roughly half of what was typical for early May before 2020. The all-time low was 4 active listings on February 19, 2022.
How have Reading home prices changed over the past 30 years?
The median single-family sale price in Reading rose from approximately $198,000 in January 1994 to a smoothed peak of about $1,167,000 in April 2026 — roughly 5.9x in nominal dollars, or about 2.6x adjusted for inflation. Growth was steepest from 2011 to 2025 (2.5x in 14 years), and the sharpest single window was 2020-2022, when the smoothed median jumped 31% in two years. Monthly readings stabilized around $912K through most of 2025, with early 2026 prices spiking on smaller monthly samples.
Why is housing inventory so low in the Greater Boston area?
Two forces explain it. First, the federal mortgage rate lock-in effect: FHFA research shows that for every percentage point market rates exceed a homeowner’s existing fixed rate, the probability of sale drops 18.1%. Second, Massachusetts has a structural housing shortage estimated at over 200,000 units — addressed only partially by recent zoning reforms like the MBTA Communities Act. The shortage was binding in Eastern Massachusetts well before rates rose, and lock-in amplified an existing problem.
Is the Reading housing market cooling in 2026?
Not yet. Reading’s 2025 data ran counter to the cooling pattern visible in some surrounding towns. The listing failure rate ticked up modestly to 12.0% (from 8.1% in 2024), but the median sale-to-list ratio rose to 103.7% (from 101.9%), the share of homes selling over asking grew to 68.5% (from 65.0%), median days on market fell to 14 (from 16), and price-cut frequency dropped to 17.5% (from 20.5%). Four of five leading indicators tightened rather than loosened. Early 2026 sales data so far points the same direction: median sale-to-list of 104.7%, 66.7% over asking, and 13-day median days on market.
What is a healthy housing inventory level for a town like Reading?
Historically, a balanced market in Reading meant 50-90 active single-family listings on a typical Saturday — roughly the range from 1994 through 2012. Inventory has been below that band continuously since 2013, and below 30 since 2020. National guidance from the National Association of Realtors considers 6 months of supply at the current sales pace to be balanced; Greater Boston is currently running well below half that level.
How does Reading compare to the rest of Massachusetts and the country?
Sources: MLS PIN (raw listings); The Warren Group (Massachusetts and Greater Boston statistics); FHFA Working Paper 24-03 (rate lock-in research); National Association of Realtors (national existing-home sales data); Massachusetts Affordable Homes Act and MBTA Communities Act (state housing policy).
Have questions about the Reading market or thinking about your next move? Talk to a Realtor at (339) 227-2282 or explore homes for sale in the area.