(FY 2026 Edition — Now Includes 5-Year Tax Rate History)
If you own a home in Massachusetts — or you’re thinking about buying one — understanding property taxes is key to planning your budget. While “property tax” might sound like just another line item on your mortgage bill, it’s actually the lifeblood of every community north of Boston. Those dollars fund the schools our kids attend, the fire and police departments that keep us safe, and the snowplows that clear our streets each winter.
This post has been updated with FY 2026 certified rates from the Massachusetts Division of Local Services. We’ve also added a brand new 5-Year Tax Rate History table (FY 2022–2026) so you can see how your town’s rate has trended over time — not just where it stands today.
But how exactly are property taxes set? And why do they vary so much from town to town — even within Middlesex County? Let’s break it down in plain English.
Table of Contents
How Massachusetts Property Taxes Work
1. Assessing Your Home’s Value
Each city or town has an assessor who estimates what your property was worth on a set date — usually January 1 of the previous year. They look at recent home sales, neighborhood trends, improvements you’ve made, and even your property’s condition. This assessed value becomes the foundation for your tax bill.
2. Setting the Tax Levy (a.k.a. “How Much the Town Needs”)
Every year, your town or city figures out how much revenue it needs to operate — schools, road repairs, libraries, public safety, you name it. After subtracting state aid and other income sources, the remainder becomes the tax levy, which must be raised through property taxes.
3. Calculating the Tax Rate
The tax rate is determined by dividing that total levy by the community’s total assessed property value (the “tax base”). The number you see — for example, $12.00 — represents how much you pay per $1,000 of your home’s assessed value.
So if your home is assessed at $500,000 and your town’s tax rate is $12, your bill would be roughly $6,000.
4. Different Classes of Property
Massachusetts law allows towns to apply different rates to residential, commercial, industrial, and open-space properties. Some towns (like Lexington or Burlington) have a split rate, which means businesses pay more per thousand than homeowners. Others (like Belmont or Westford) use a single, uniform rate for everyone.
5. Proposition 2½ and Overrides
You’ve probably heard the phrase “Prop 2½.” It limits how much a community’s total tax levy can increase each year — generally 2.5%, plus the value of any new growth — unless voters approve an override or special debt exclusion. These votes often fund major school renovations, fire stations, or other big projects.
6. Exemptions and Tax Credits
Massachusetts offers several programs to reduce the tax burden for qualifying residents — including seniors, veterans, and homeowners with disabilities. There’s also the state’s “Circuit Breaker” tax credit for eligible older residents whose property taxes or rent exceed a certain portion of their income.
Why Property Tax Rates Vary So Much
Every town makes independent decisions about its budget, spending priorities, and classification system. For example:
-
A town with strong commercial growth can shift more of the burden away from homeowners.
-
Towns with higher average home values often have lower tax rates, because they can raise the same revenue from a larger base.
-
Smaller communities without much business tax revenue may need to charge a higher rate to fund essential services.
That’s why a homeowner in Woburn pays a very different rate than someone in Acton or Lexington — even if their homes are worth about the same.
Here’s a look at FY 2026 residential property tax rates for towns and cities across Middlesex and Essex Counties, focusing on the North-of-Boston area. The vs. FY 2025 column shows the change from last year. Rates are listed per $1,000 of assessed value.
🔍 Looking up a specific town? You can look up any Massachusetts municipality directly at the MA Division of Local Services Tax Rates by Class report.
| Municipality | FY | Residential | Commercial | Industrial | Personal Property | vs. FY 2025 |
|---|---|---|---|---|---|---|
| Acton | 2026 | 16.23 | 16.23 | 16.23 | 16.23 | ▼ 0.92 |
| Andover | 2026 | 12.31 | 24.18 | 24.18 | 24.18 | ▼ 0.18 |
| Arlington | 2026 | 10.67 | 10.67 | 10.67 | 10.67 | ▼ 0.10 |
| Bedford | 2026 | 12.49 | 28.09 | 28.09 | 28.09 | ▲ 0.45 |
| Belmont | 2026 | 11.51 | 11.51 | 11.51 | 11.51 | ▲ 0.12 |
| Beverly | 2026 | 10.81 | 20.98 | 20.98 | 20.98 | ▼ 0.18 |
| Billerica | 2026 | 11.61 | 25.88 | 25.88 | 25.88 | ▲ 0.24 |
| Burlington | 2026 | 8.69 | 25.78 | 25.78 | 25.78 | ▲ 0.03 |
| Chelmsford | 2026 | 13.27 | 15.64 | 15.64 | 15.50 | ▼ 0.63 |
| Concord | 2026 | 13.05 | 12.20 | 12.20 | 12.20 | ▼ 0.21 |
| Lexington | 2026 | 12.31 | 24.18 | 24.18 | 24.18 | ▲ 0.08 |
| Medford | 2026 | 8.63 | 16.68 | 16.68 | 16.68 | ▼ 0.17 |
| Melrose | 2026 | 11.47 | 20.61 | 20.61 | 20.61 | ▲ 1.57 |
| North Reading | 2026 | 13.02 | 13.01 | 13.01 | 13.01 | ▼ 0.04 |
| Reading | 2026 | 10.96 | 12.55 | 12.55 | 12.55 | ▼ 0.43 |
| Stoneham | 2026 | 10.06 | 19.15 | 19.15 | 19.15 | ▼ 0.17 |
| Wakefield | 2026 | 11.74 | 22.40 | 22.40 | 22.40 | ▲ 0.39 |
| Waltham | 2026 | 10.32 | 22.18 | 22.18 | 22.18 | ▲ 0.50 |
| Watertown | 2026 | 12.20 | 23.47 | 23.47 | 23.47 | ▲ 0.52 |
| Westford | 2026 | 13.11 | 13.11 | 13.11 | 13.11 | ▼ 0.36 |
| Wilmington | 2026 | 11.41 | 26.25 | 26.25 | 26.25 | ▼ 0.04 |
| Winchester | 2026 | 11.08 | 10.56 | 10.56 | 10.56 | ▼ 0.01 |
| Woburn | 2026 | 9.15 | 21.43 | 21.43 | 21.43 | ▲ 0.61 |
*(Rates shown are certified by the Massachusetts Division of Local Services as of FY 2026. Rates per $1,000 of assessed value.)*
NEW: 5-Year Tax Rate History (FY 2022–2026)
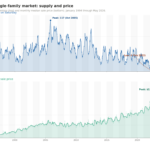
One of the most valuable things you can track as a homeowner or buyer is the trend — not just the current rate. Most communities north of Boston have seen their residential rates decrease over the past five years, largely because rising assessed property values mean the same levy can be collected at a lower rate. The table below gives the full picture.
🔍 Don’t see your town? Look up any Massachusetts municipality directly at the MA Division of Local Services Tax Rates by Class report.
| Municipality | FY 2022 | FY 2023 | FY 2024 | FY 2025 | FY 2026 | 5-Yr Change |
|---|---|---|---|---|---|---|
| Acton | 19.45 | 17.56 | 16.67 | 17.15 | 16.23 | ▼ 3.22 |
| Andover | 14.60 | 13.66 | 12.88 | 12.49 | 12.31 | ▼ 2.29 |
| Arlington | 11.42 | 11.21 | 10.59 | 10.77 | 10.67 | ▼ 0.75 |
| Bedford | 13.58 | 12.48 | 11.88 | 12.04 | 12.49 | ▼ 1.09 |
| Belmont | 11.56 | 11.24 | 10.56 | 11.39 | 11.51 | ▼ 0.05 |
| Beverly | 12.17 | 11.26 | 11.23 | 10.99 | 10.81 | ▼ 1.36 |
| Billerica | 12.64 | 11.87 | 11.29 | 11.37 | 11.61 | ▼ 1.03 |
| Burlington | 9.95 | 9.40 | 8.94 | 8.66 | 8.69 | ▼ 1.26 |
| Chelmsford | 15.77 | 14.37 | 13.62 | 13.90 | 13.27 | ▼ 2.50 |
| Concord | 14.76 | 12.96 | 13.13 | 13.26 | 13.05 | ▼ 1.71 |
| Lexington | 13.80 | 13.00 | 12.25 | 12.23 | 12.31 | ▼ 1.49 |
| Medford | 9.01 | 8.65 | 8.52 | 8.80 | 8.63 | ▼ 0.38 |
| Melrose | 10.57 | 10.42 | 9.93 | 9.90 | 11.47 | ▲ 0.90 |
| North Reading | 15.00 | 13.99 | 13.21 | 13.06 | 13.02 | ▼ 1.98 |
| Reading | 13.33 | 12.59 | 11.72 | 11.39 | 10.96 | ▼ 2.37 |
| Stoneham | 10.41 | 11.10 | 10.59 | 10.23 | 10.06 | ▼ 0.35 |
| Tewksbury | 15.20 | 14.10 | 13.39 | 13.22 | 12.56 | ▼ 2.64 |
| Wakefield | 12.32 | 11.73 | 11.25 | 11.35 | 11.74 | ▼ 0.58 |
| Waltham | 11.14 | 10.32 | 9.64 | 9.82 | 10.32 | ▼ 0.82 |
| Watertown | 13.25 | 13.58 | 11.70 | 11.68 | 12.20 | ▼ 1.05 |
| Westford | 16.12 | 14.76 | 13.77 | 13.47 | 13.11 | ▼ 3.01 |
| Wilmington | 13.03 | 11.94 | 11.43 | 11.45 | 11.41 | ▼ 1.62 |
| Winchester | 12.51 | 11.80 | 11.33 | 11.09 | 11.08 | ▼ 1.43 |
| Woburn | 9.34 | 8.70 | 8.06 | 8.54 | 9.15 | ▼ 0.19 |
*(5-Yr Change = FY 2026 minus FY 2022. Source: MA Division of Local Services, Tax Rates by Class report. Residential rates per $1,000 of assessed value.)*
Source: Massachusetts Division of Local Services — Tax Rates by Class. To look up any town not listed here, visit the DLS gateway directly.
Making Sense of the Numbers
A higher tax rate doesn’t always mean you’re paying more overall — it depends on your home’s assessed value. For example, a $500,000 home in Acton (rate = 16.23) would owe about $8,115 annually, while a $900,000 home in Lexington (rate = 12.31) would owe about $11,079.
It’s all about the relationship between assessed value and rate — and how your community balances its budget. The 5-year history table above is especially useful here: many towns have seen their rates fall while their actual tax bills have risen, simply because home values have climbed significantly since 2022.
🔽 Top 5 Lowest Residential Property Tax Rates (FY 2026)
| Rank | Town | Rate per $1,000 | Snapshot |
|---|---|---|---|
| 1 | Medford | $8.63 | A mix of residential and commercial properties allows Medford to balance its budget without heavy homeowner increases. |
| 2 | Burlington | $8.69 | With a robust business base, Burlington offsets much of the residential tax burden through commercial revenue. |
| 3 | Woburn | $9.15 | Woburn benefits from strong commercial growth and new development, keeping the residential rate very competitive. |
| 4 | Stoneham | $10.06 | Stoneham’s rate has trended steadily downward and now joins the region’s lowest in FY 2026. |
| 5 | Waltham | $10.32 | A thriving business community and stable property values help Waltham keep residential taxes manageable. |
🔼 Top 5 Highest Residential Property Tax Rates (FY 2026)
| Rank | Town | Rate per $1,000 | Snapshot |
|---|---|---|---|
| 1 | Acton | $16.23 | Excellent schools and extensive community services drive Acton’s higher rate, though it has dropped nearly $3.25 since FY 2022. |
| 2 | Chelmsford | $13.27 | A family-friendly community with steady growth — down meaningfully from its FY 2022 rate of $15.77. |
| 3 | Westford | $13.11 | Known for top-tier schools and town amenities, Westford’s rate has also trended downward over five years. |
| 4 | Concord | $13.05 | Concord’s uniform single rate reflects its historic character and strong community investment. |
| 5 | Tewksbury | $12.56 | Infrastructure investments continue, though Tewksbury’s rate has fallen nearly $2.65 since FY 2022. |
💡 What These Numbers Really Mean
A higher rate doesn’t necessarily mean a “more expensive” town — it all depends on assessed values. For example, homes in Woburn may carry a lower rate, but a property in Winchester could have a higher assessed value and still produce a larger bill despite a lower rate.
The takeaway? Compare total tax bills, not just the rate. And with the 5-year history above, you can also see whether a town’s rate is trending up or down — useful context when planning a purchase or budgeting long-term. Your property’s assessed value, local exemptions, and community priorities all factor into what you actually pay.
What Homeowners Can Do
-
Check your assessment: Visit your town’s assessor’s website to confirm that your property details (square footage, lot size, condition, etc.) are accurate.
-
Know your local rate: Each city or town posts its certified rates every fiscal year, often under “Tax Rates” or “Assessor’s Office.”
-
Review available exemptions: If you’re a senior, veteran, or qualify for income-based assistance, apply early — many towns have deadlines in the fall.
-
Stay involved locally: Overrides and budget votes directly influence property tax increases. Attend town meetings, or at least follow your local finance committee’s updates.
Final Thoughts
Property taxes may not be the most exciting topic, but they’re one of the most important pieces of homeownership in Massachusetts. Understanding how they work — and why they differ from town to town — helps you plan, budget, and make informed decisions when buying or selling a home.
If you’d like a personalized breakdown of property tax trends in your specific community north of Boston — from Woburn to Reading, Lexington, or beyond — I’m happy to help.
👉 Reach out anytime for local insights, tax comparisons, or a full market snapshot.